> ## Documentation Index
> Fetch the complete documentation index at: https://docs.topsort.com/llms.txt
> Use this file to discover all available pages before exploring further.

# Finance Reporting

export const LastUpdated = ({date, lang = "en"}) => {
  const translations = {
    en: "Last updated:",
    es: "Última actualización:",
    pt: "Última atualização:",
    fr: "Dernière mise à jour:",
    de: "Zuletzt aktualisiert:"
  };
  const label = translations[lang] || translations.en;
  return <>
<style>{`
.last-updated-component {
display: inline-flex;
align-items: center;
gap: 8px;
padding: 10px 16px;
border-radius: 8px;
margin-top: 12px;
margin-bottom: 16px;
font-size: 14px;
background-color: rgba(0, 0, 0, 0.05);
border: 1px solid rgba(0, 0, 0, 0.12);
color: rgba(0, 0, 0, 0.75);
line-height: 1;
}

        .last-updated-component svg {
          flex-shrink: 0;
          vertical-align: middle;
        }

        .last-updated-component span {
          display: inline-flex !important;
          align-items: center !important;
          line-height: 1 !important;
        }

        [data-theme="dark"] .last-updated-component {
          background-color: #3a3a3a;
          border: 2px solid #888888;
          color: #ffffff;
        }

        [data-theme="dark"] .last-updated-component svg {
          stroke: #ffffff;
        }
      `}</style>
      <div className="last-updated-component">
        <svg width="16" height="16" viewBox="0 0 24 24" fill="none" stroke="currentColor" strokeWidth="2" strokeLinecap="round" strokeLinejoin="round">
          <circle cx="12" cy="12" r="10" />
          <polyline points="12 6 12 12 16 14" />
        </svg>
        <span>
          <strong style={{
    fontWeight: 600
  }}>{label}</strong> 
          <time dateTime={date}>{date}</time>
        </span>
      </div>
    </>;
};

<div style={{ textAlign: "justify", marginBottom: "1.5rem" }}>
  The Finance Tab is a central hub for managing and monitoring financial aspects
  related to ad spend and vendor balances, organized into three sections:
  Trends, Balance/Ad Spend Summary, and Activity Log.
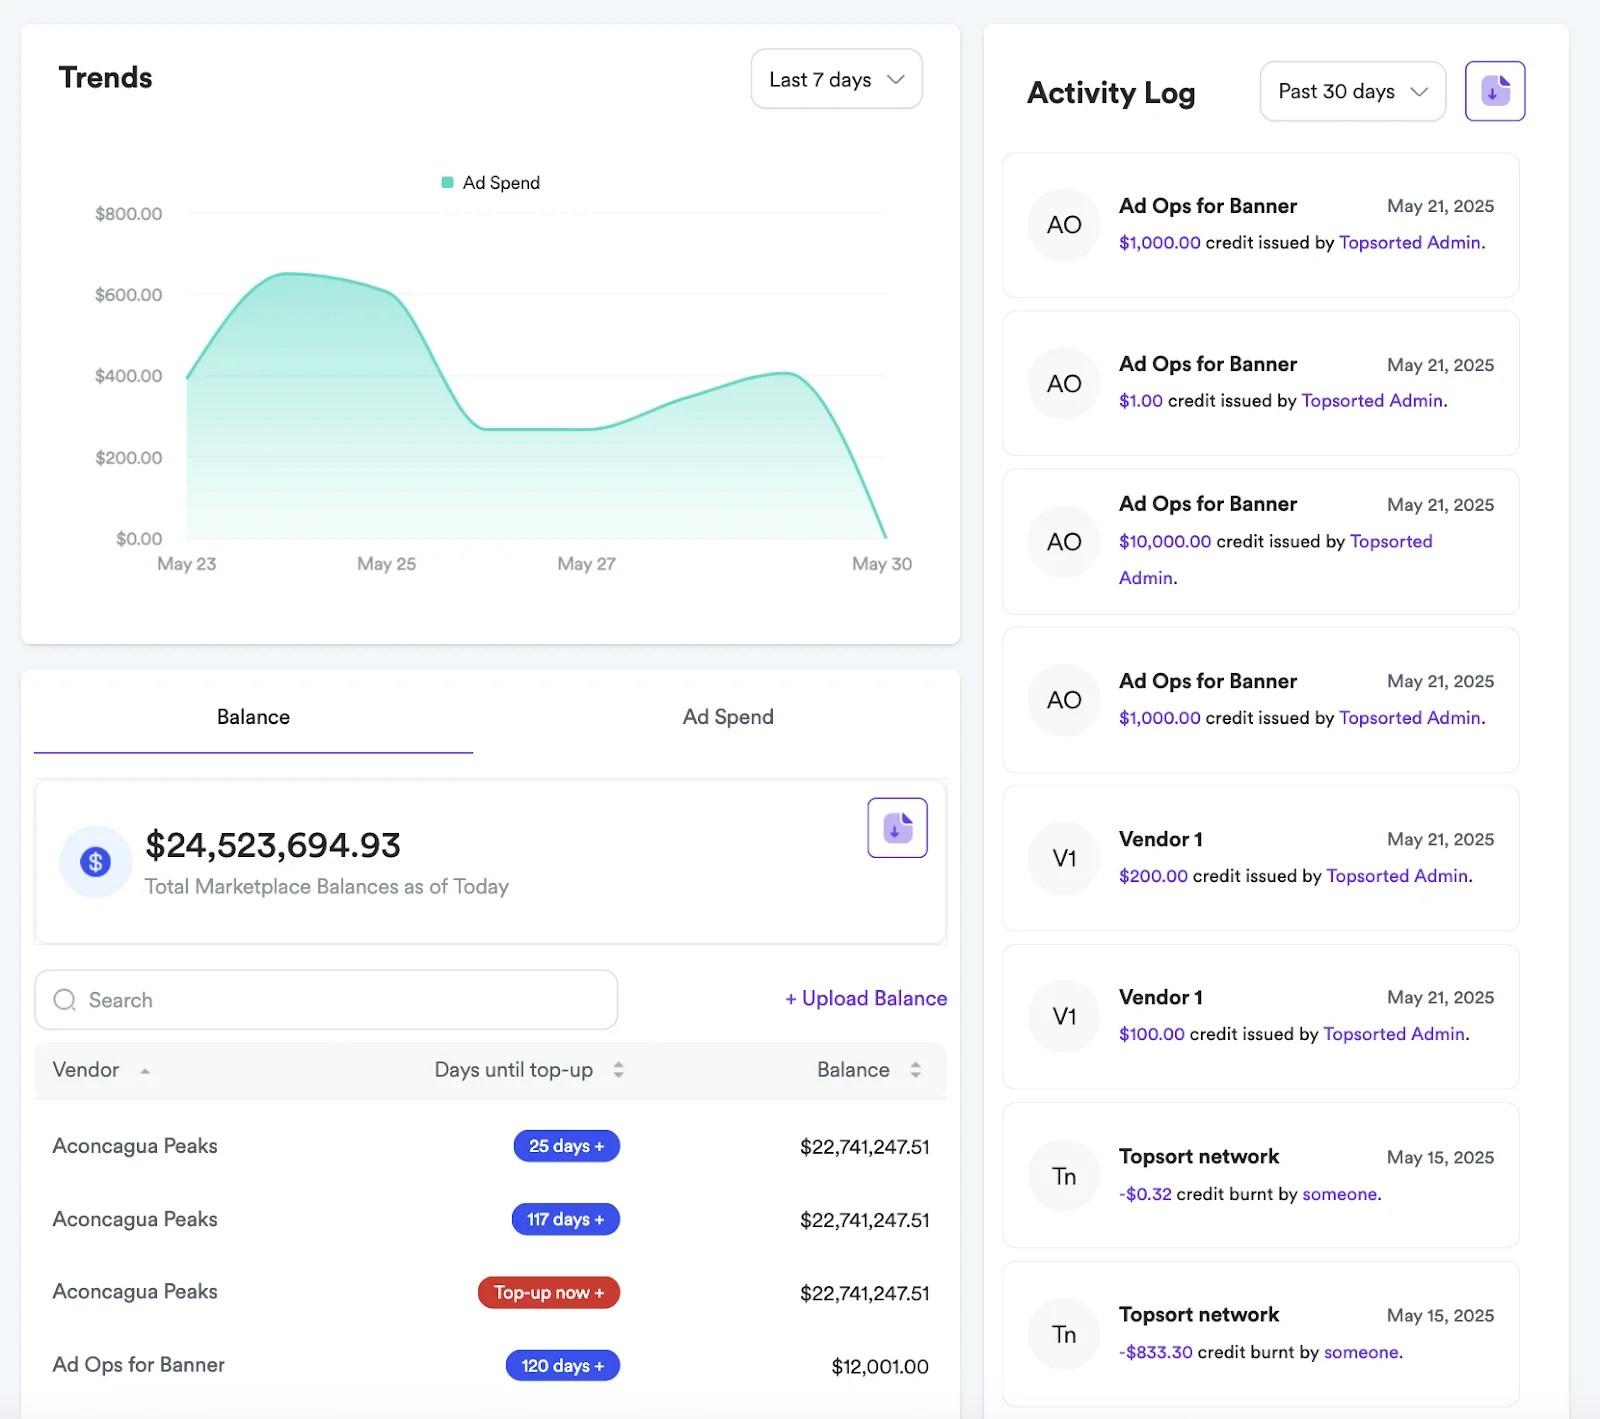
</div>

<Frame>
  <img src="https://mintcdn.com/topsort/JfdWUceY7Se3NW-0/images/knowledge-base/ad-platform-reporting-and-analytics-finance-reporting-vendor.webp?fit=max&auto=format&n=JfdWUceY7Se3NW-0&q=85&s=aeef749a888a22c28e993d511cb9a0da" alt="Screenshot showing for finance reporting functionality." width="1600" height="1419" data-path="images/knowledge-base/ad-platform-reporting-and-analytics-finance-reporting-vendor.webp" />
</Frame>

## Trends Section

<div style={{ textAlign: "justify", marginBottom: "1.5rem" }}>
  This section shows adspend over a definable period, allowing users to select
  different timeframes for analysis.
</div>

## Balance and Ad Spend Summary

<div style={{ textAlign: "justify", marginBottom: "1.5rem" }}>
  This section provides a financial summary of balances and aggregated ad spend,
  with two distinct views: "Balance" and "Ad Spend."
</div>

<div style={{ textAlign: "justify", marginBottom: "1.5rem" }}>
  In "Balance" mode, it displays the total marketplace balances. Users can
  search vendors and adjust balances.
</div>

<div style={{ textAlign: "justify", marginBottom: "1.5rem" }}>
  In "Ad Spend" mode, it shows total ad spend for a selected month. Users can
  filter vendors, and a table presents "Vendor" and their "Ad Spend," along with
  an action icon for further management.
</div>

<div style={{ textAlign: "justify", marginBottom: "1.5rem" }}>
  Also, tools are available to bulk update vendor balances and to download
  balance and ad spend as a CSV file.
</div>

## Activity Log

<div style={{ textAlign: "justify", marginBottom: "1.5rem" }}>
  This section shows recent financial transactions. Each entry details the user,
  activity description, transaction amount and date. You can also download a CSV
  file with the activity log of the selected timeframe.
</div>

***

<LastUpdated date="2025-11-18" />
